
Traffic Stop Statistics
Traffic Stop Statistics
The Abington Township Police Department is providing the above below data as a recommendation from The Final Report of the President Obama’s Taskforce on 21st Century Policing (https://cops.usdoj.gov/pdf/taskforce/taskforce_finalreport.pdf). We collect these numbers as a means to identify and prevent issues of biased-based policing. It is important to note that these numbers are more representative of Abington’s daytime and highway population than our jurisdictions residential population. There are many variables when collecting and analyzing this data. You can learn more about these issue by examining the data presented by the Police Executive Research Forum’s 2005 project publication, Understanding Race Data from Vehicle Stops: A Stakeholder’s Guide. A link to the 95- page document is provided below. https://cops.usdoj.gov/pdf/publications/understanding_Race_Data.pdf
While Pennsylvania does not require agencies to collect this data for traffic citations and stops, we recognize the importance of transparency and accountability and will continue to collect such data. As benchmarking and analysis methods evolve, we will continue to improve our processes. If you have any questions or suggestions regarding this data please contact Lieutenant Magee at kmagee@abingtonpa.gov.
| April 2010 US Census Data | ||||
| Philadelphia County | Abington | Cheltenham | Upper Moreland | |
| Population | 1,526,006 | 55,310 | 36,793 | 24,015 |
| White | 44.8% | 79.3% | 54.1% | 85.0% |
| Black or African American | 43.6% | 12% | 32.6% | 5.9% |
| American Indian and Alaska Native | 0.9% | 0% | 0.7% | 0.1% |
| Asian | 7.8% | 4.6% | 7.0% | 5.4% |
| Native Hawaiian and Other Pacific Islander | 0.2% | 0% | 0.1% | 0.1% |
| Two ore More Races | 2.8% | 3.3% | 4.0% | 2.8% |
| Hispanic or Latino | 15.2% | 4.3% | 5.2% | 5.4% |
| White, not Hispanic or Latino | 34.3% | 76.3% | 51.5% | 80.7% |
| Average Daily Traffic (PennDOT) Roadway 2018 | Average Daily Traffic (Vehicles) |
| Huntingdon Pike | 32,000 |
| Old York Rd. | 29,000 |
| Welsh Rd. | 27,000 |
| Easton Rd. | 13,000 |
| Susquehanna Rd. | 13,000 |
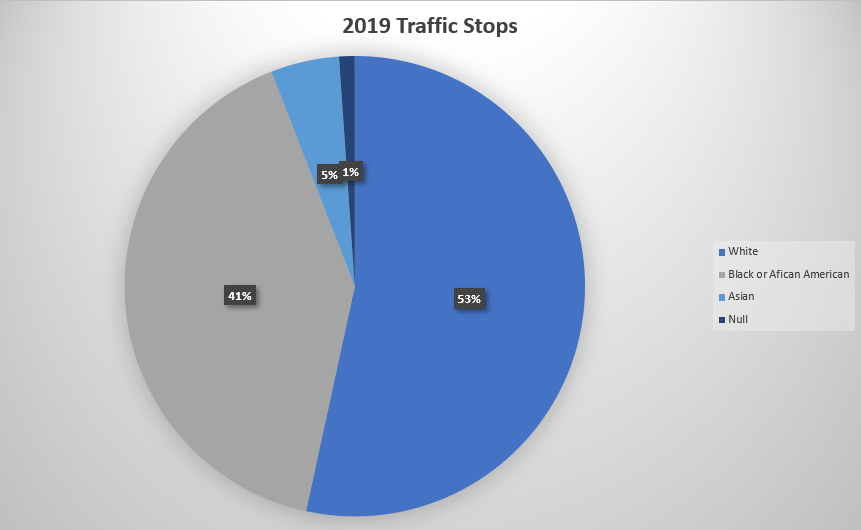
Click image to enhance size of image.